Report Cards
Dashboard Report Cards are customizable snapshots of data that can be displayed on a user's homepage.
Create Report
Dashboard reports can be created and customized under operations. Click on a section under operations to view available reports.
The subscribers section features commonly used reports like Leads by Package, Subscriber Packages Status and Current Subscribers.
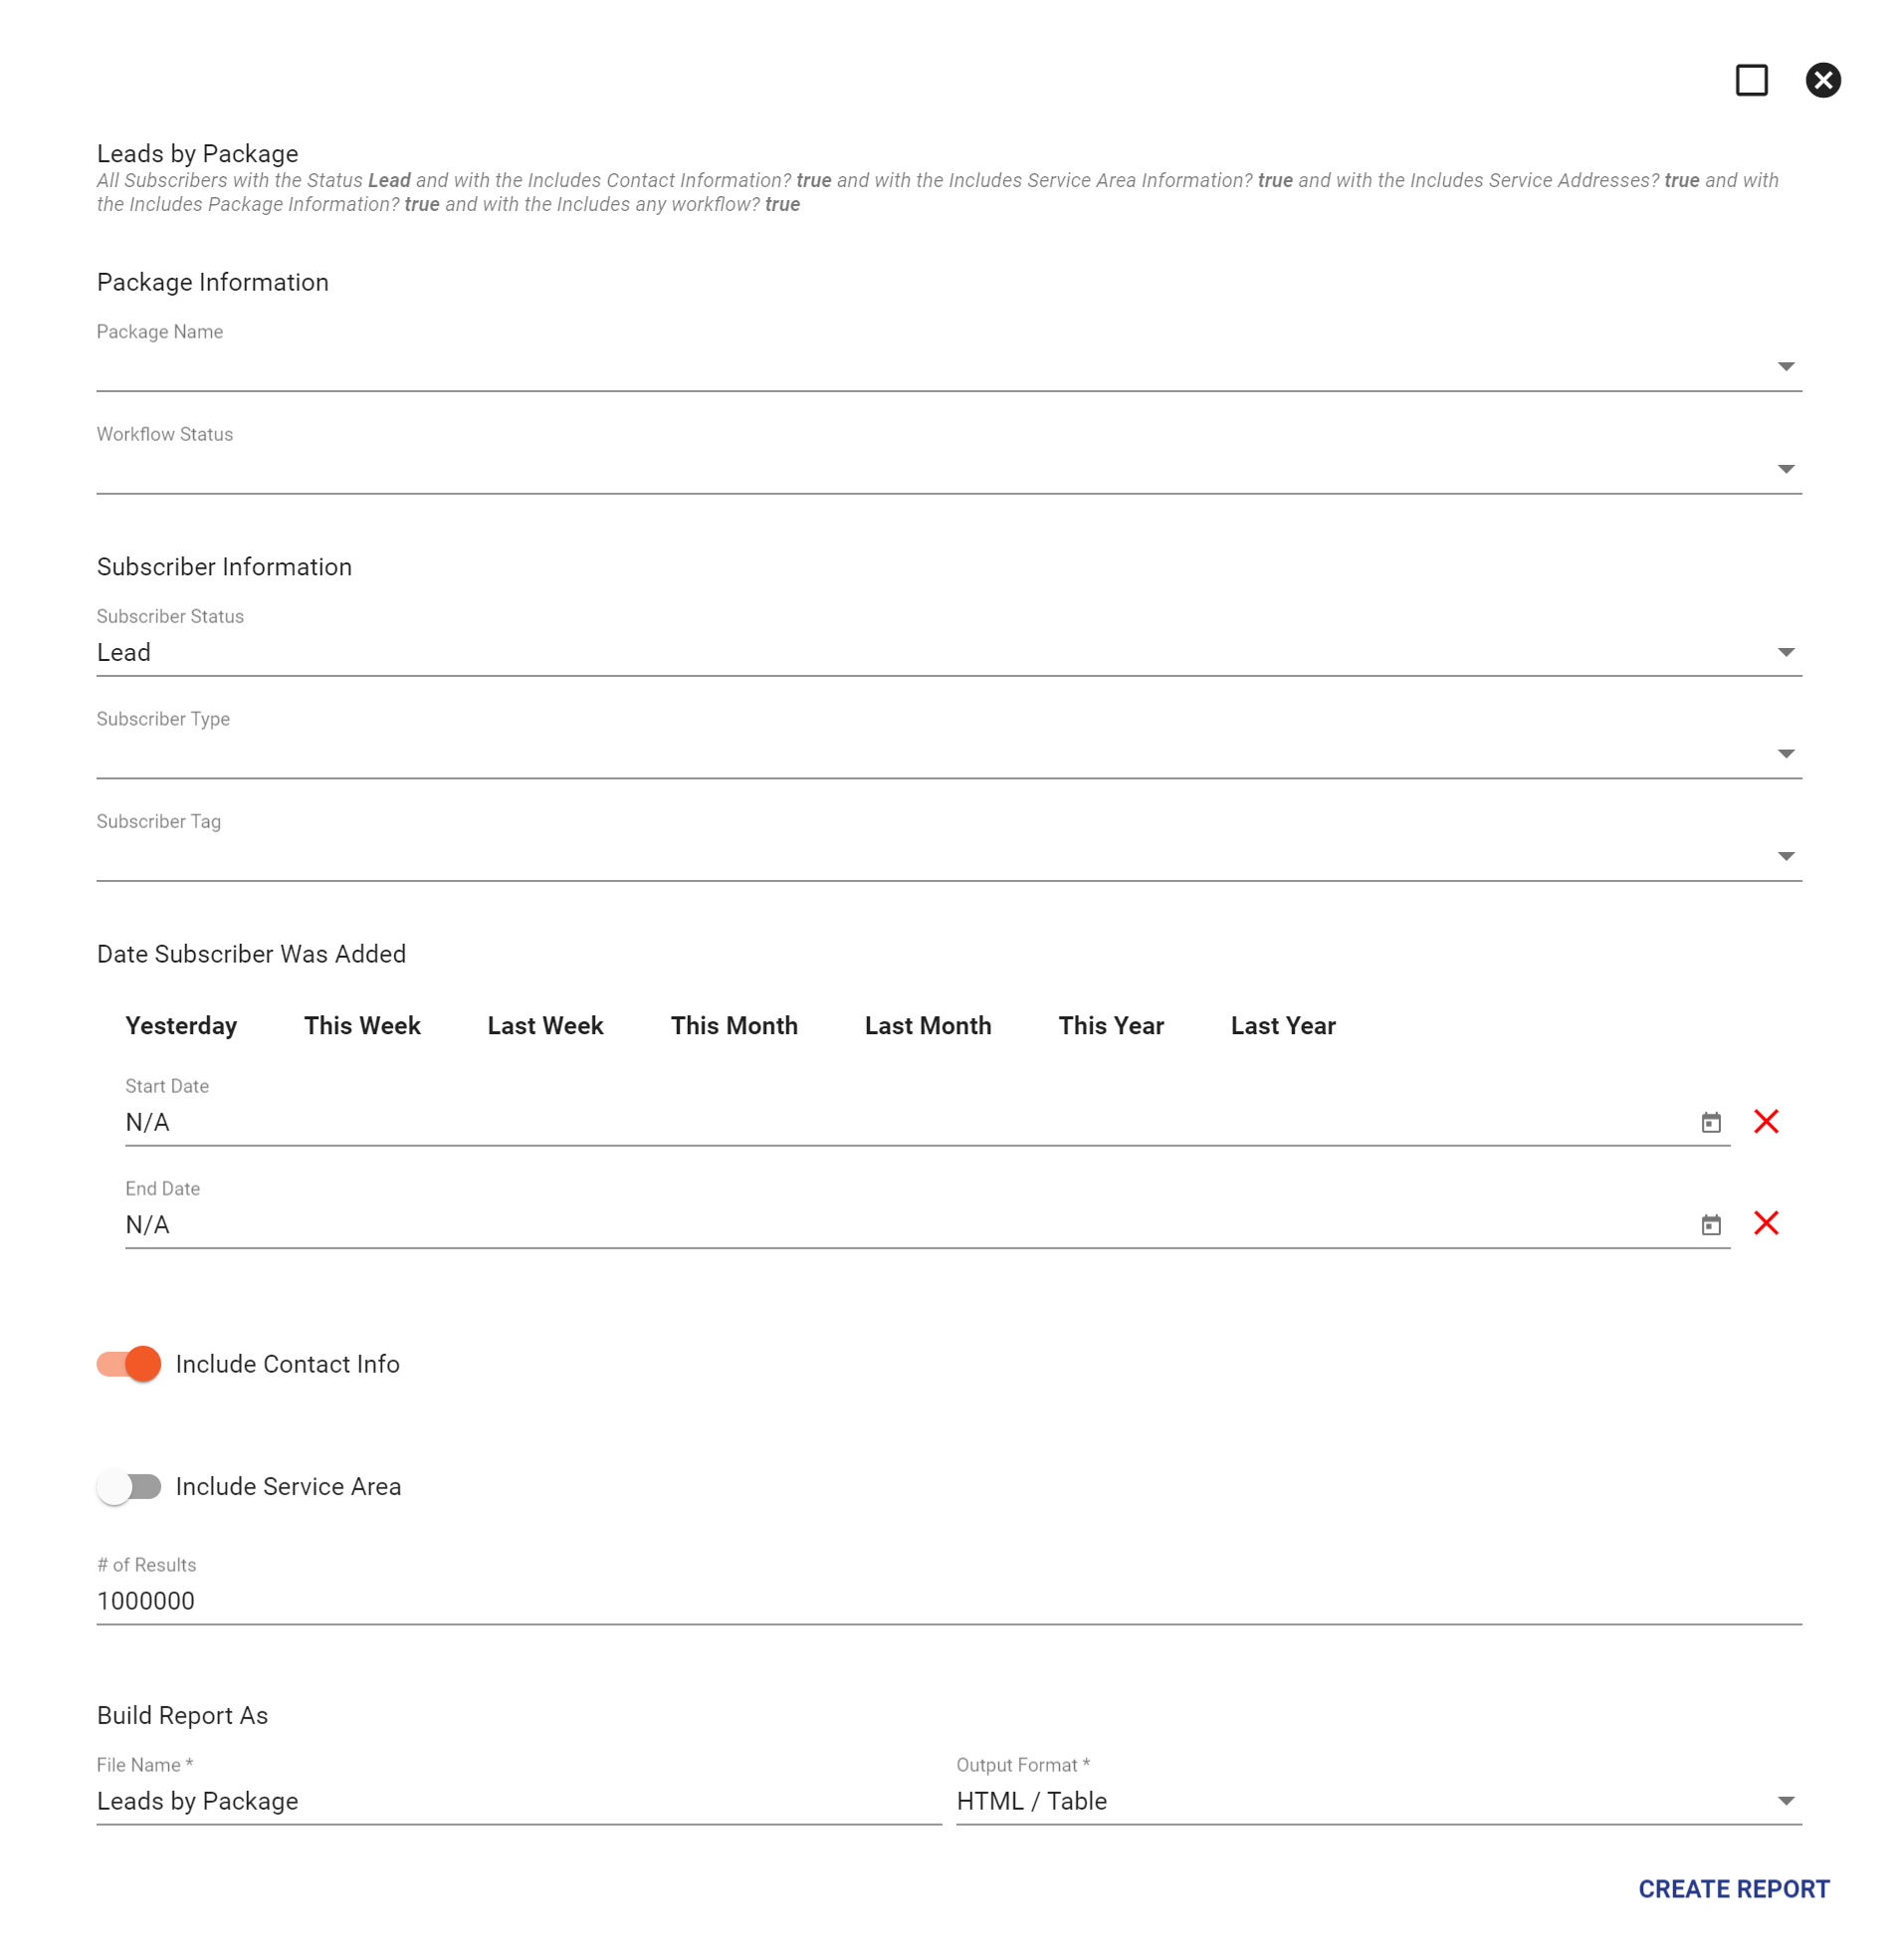
Select a report to generate. (The below report example is Leads by Package.)
Choose the data to be compiled in a report from the dropdown menu, or leave it blank to pull data from all fields.
Click CREATE REPORT to generate a report.
View the details of the report or filter which results to display under the 
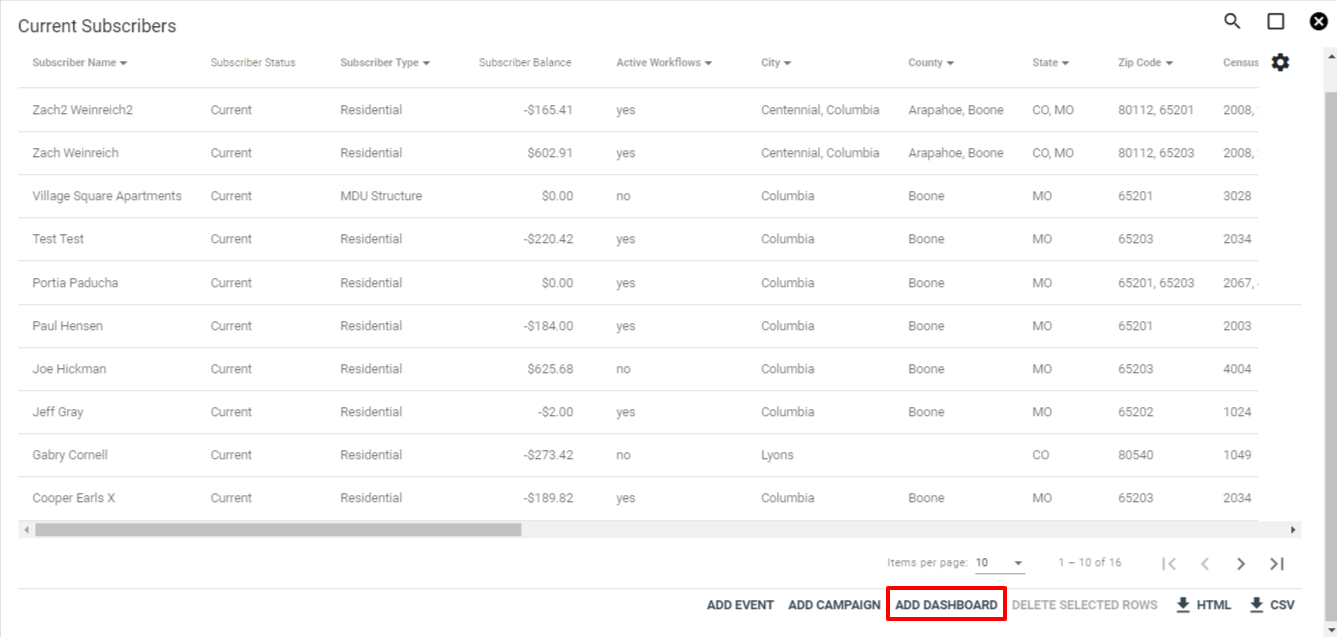
Add Dashboard Card
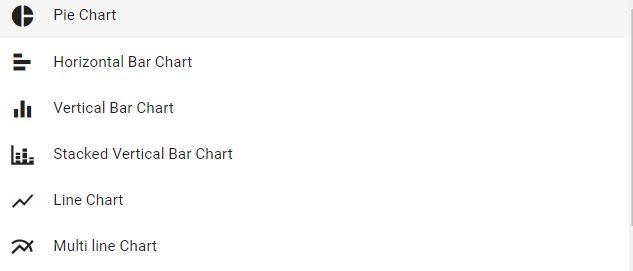
Create a name for the dashboard and select a chart type* option to display the data.
The "Bars" and "Bar Size" dropdown options dictate how the data is displayed.
Input the X-Axis and Y-Axis Lable descriptions and choose a color scheme if desired. Toggle between the narrow and wide display options for the dashboard card.
Select which groups will have access to the dashboard report card.
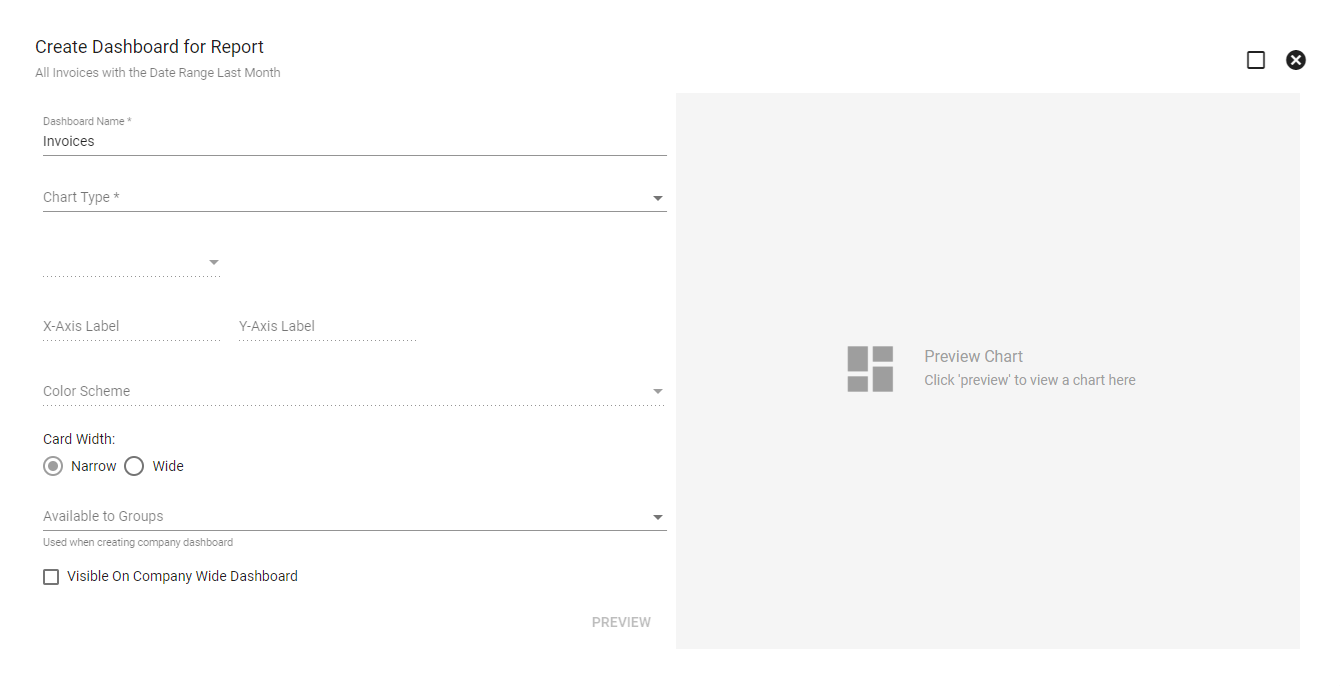
*Select a method of displaying the dashboard report card. Available chart options also include a count / sum of results.
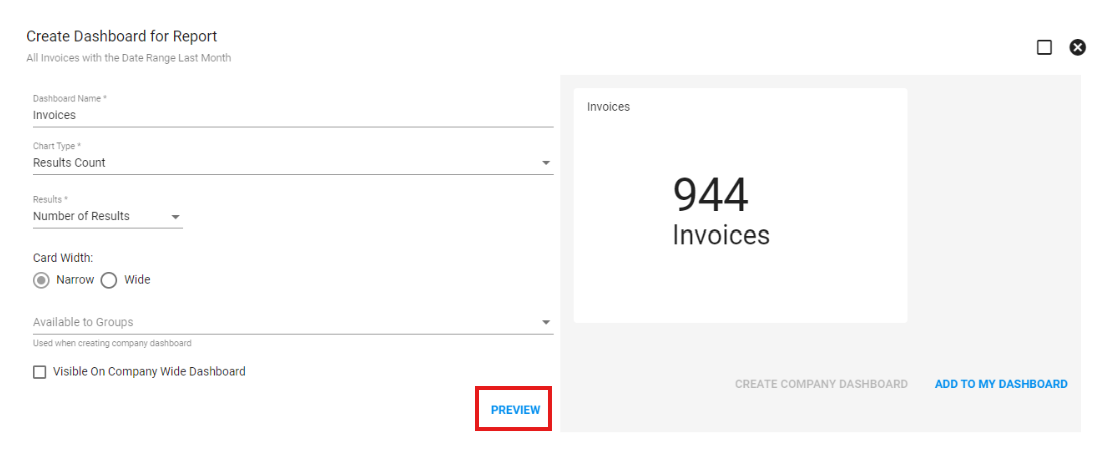
Preview the selected chart type by clicking PREVIEW at the bottom of the page.
Creating a company dashboard makes a specific dashboard available to all users of a specific group. For example, a marketing administrator could create a dashboard visible only to the employees in the marketing group. These dashboards are accessible via Settings, the three dots in the top right 
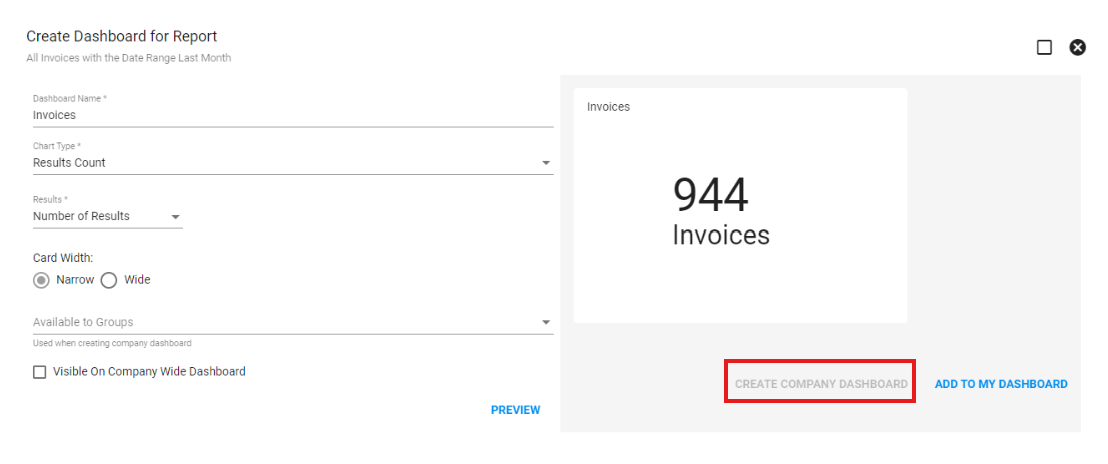
Selecting ADD TO MY DASHBOARD will only apply the report card to that user's specific dashboard.
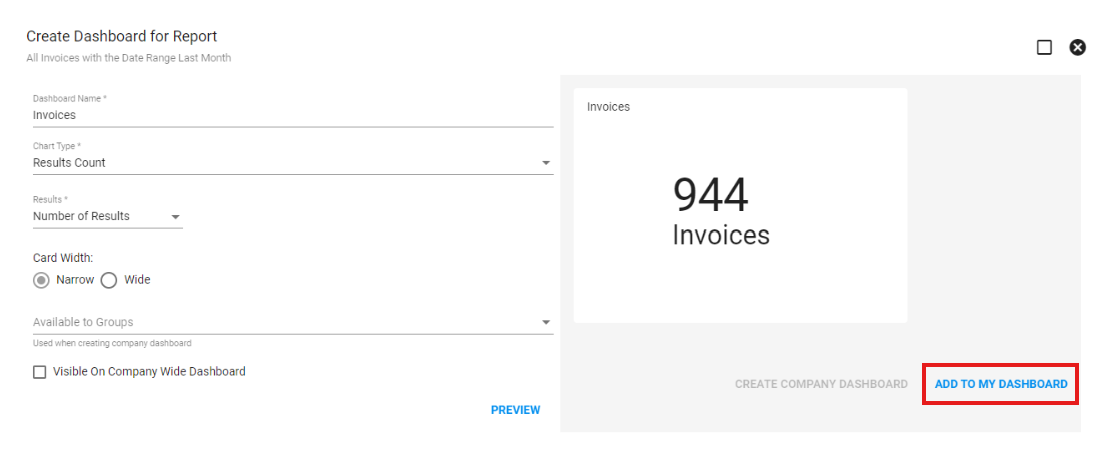
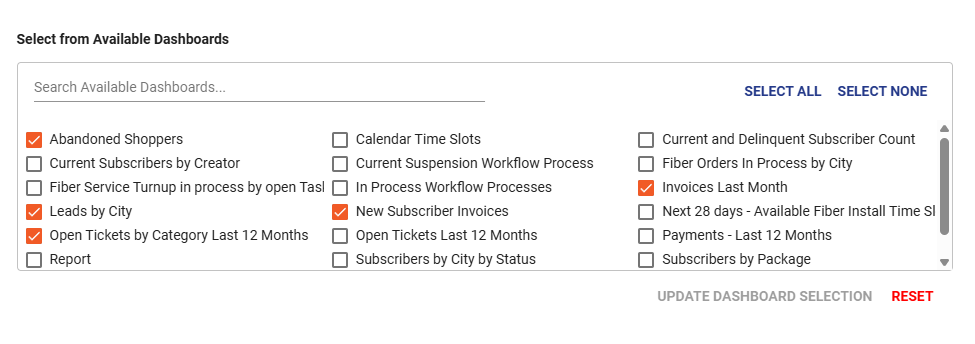
By checking "Visible on Company Dashboard", you can use the drop down below it to select one of the existing Company Wide Dashboards to add your report card to. Check out this page for more information on Company Wide Dashboards.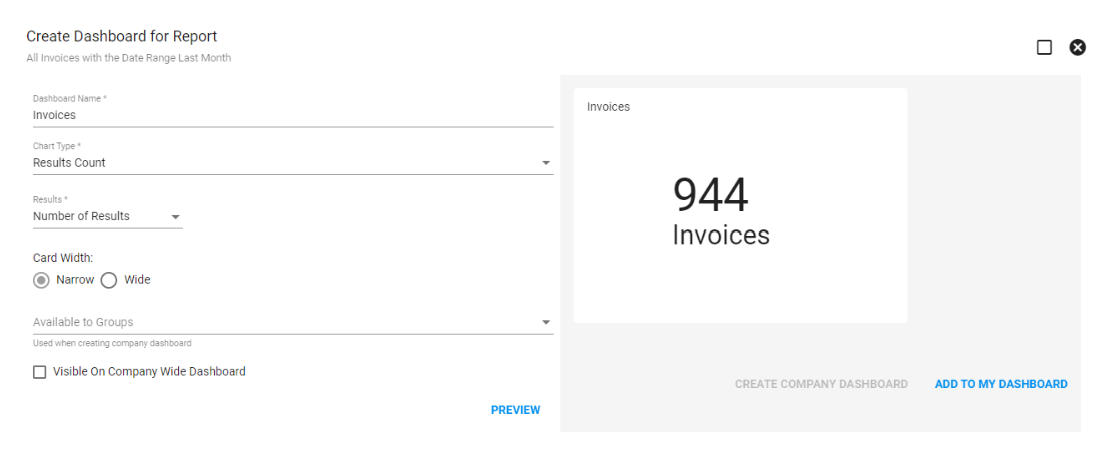
View Dashboard Card
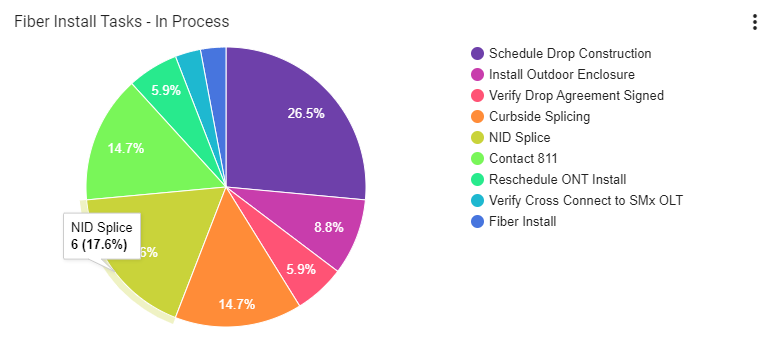
Below is an example of a dashboard card generated based on a report.
Click on the 
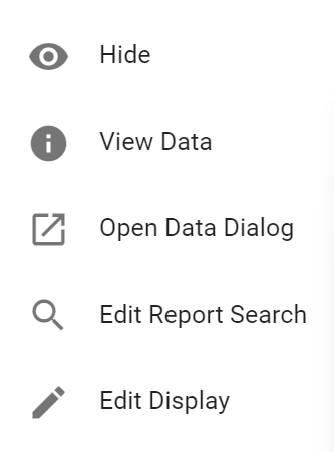
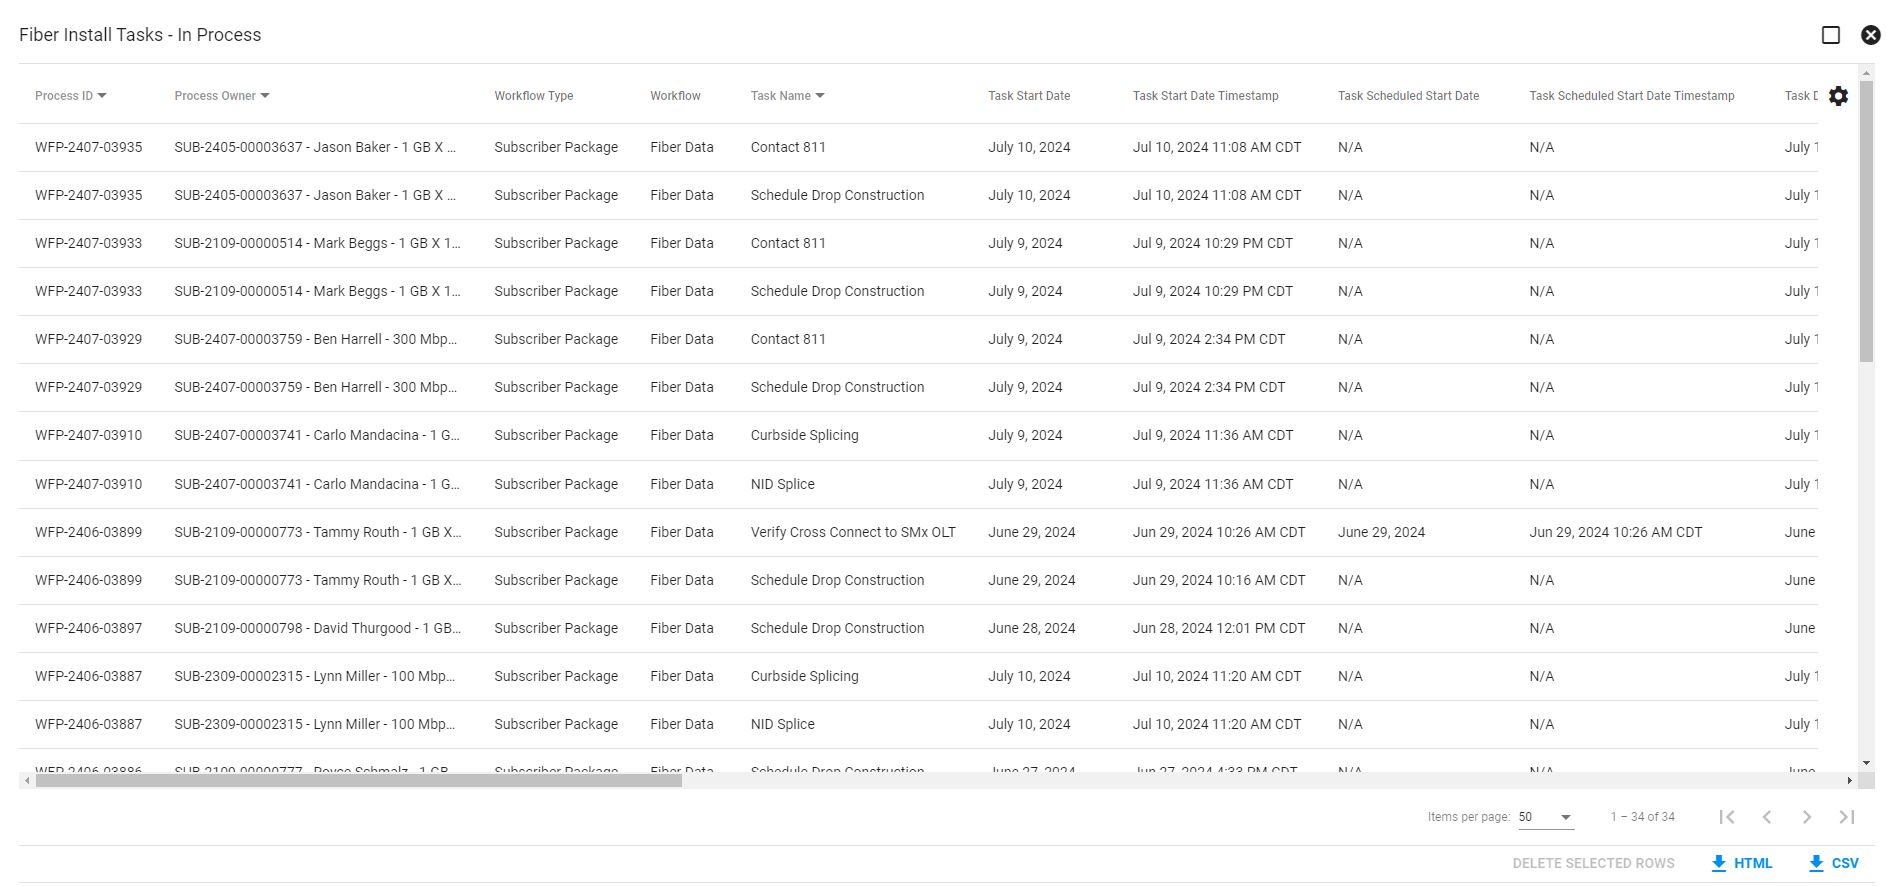
Select View Data to change the display of the dashboard card from a graph to a numerical list of data.
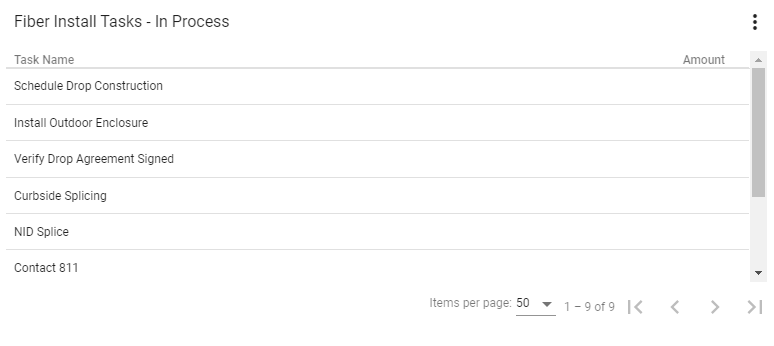
Select Open Data Dialogue to view the original report that generated the dashboard card.
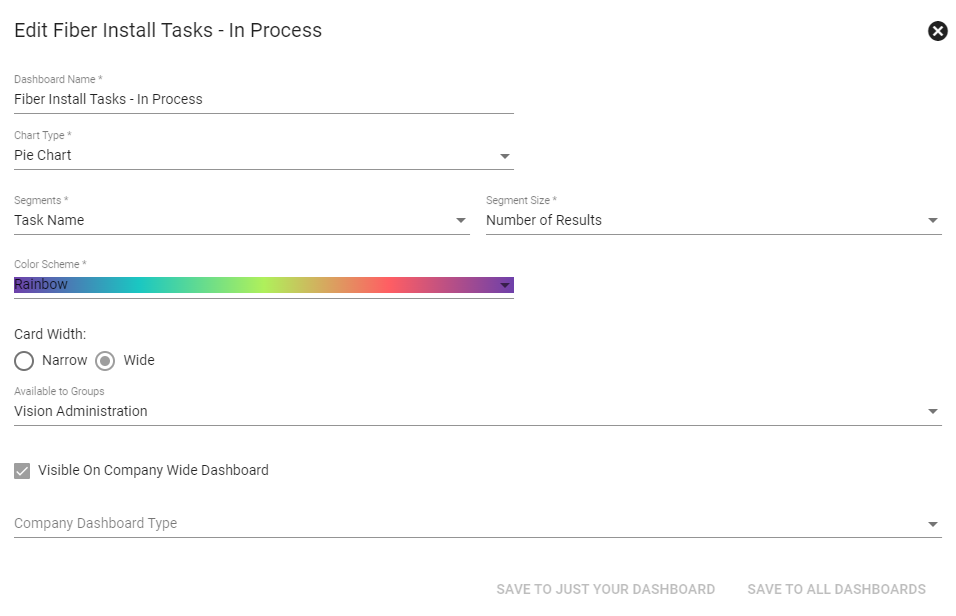
Edit Dashboard Card
To edit the display of a dashboard card click the
Edit Display allows you to make changes to the dashboard card display and graph details.
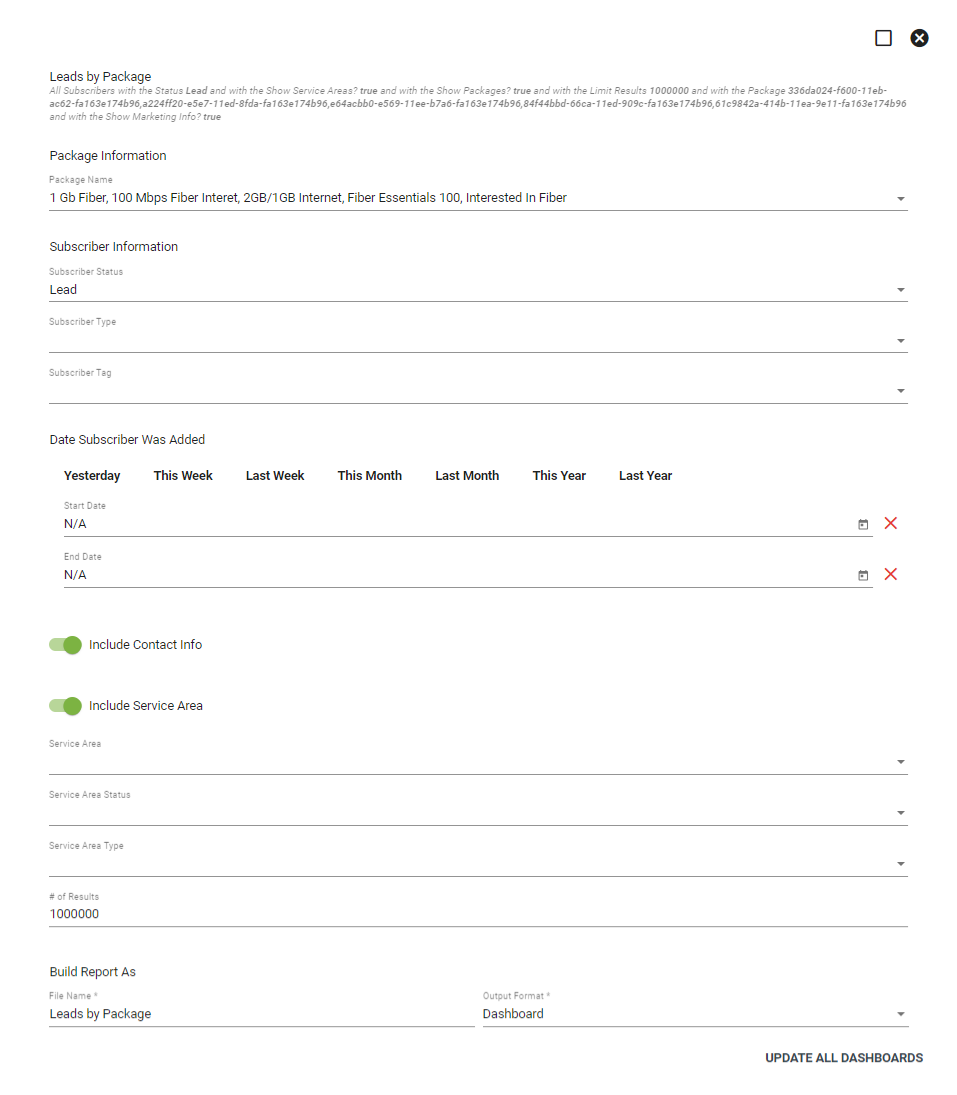
To make a change or edit the report search of the dashboard can be done by going to the 3 dot menu![]() Edit Report Search. This is where changes can be made to the report by adding new search peramiters to the report, edit the time range of the report, and make any changes to service areas, statuses, and types. Once the changes are made to confirm them and update the dashboard card click UPDATE ALL DASHBOARDS.
Edit Report Search. This is where changes can be made to the report by adding new search peramiters to the report, edit the time range of the report, and make any changes to service areas, statuses, and types. Once the changes are made to confirm them and update the dashboard card click UPDATE ALL DASHBOARDS.
(The ability to do this feature is permission based)
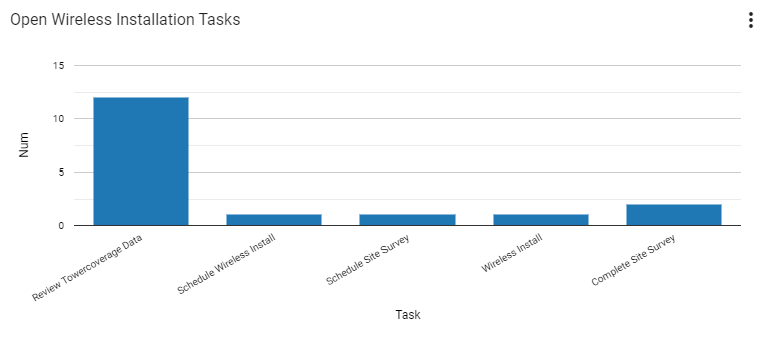
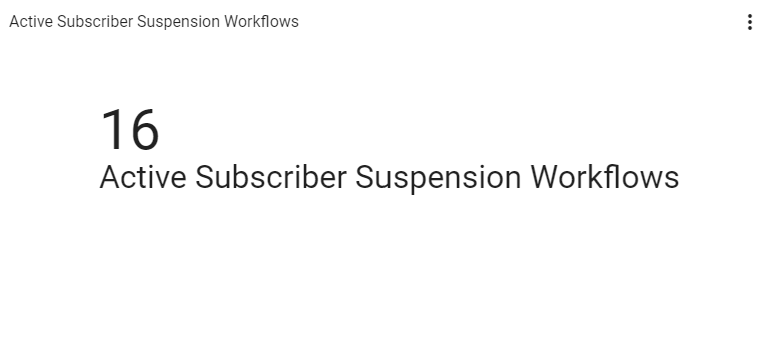
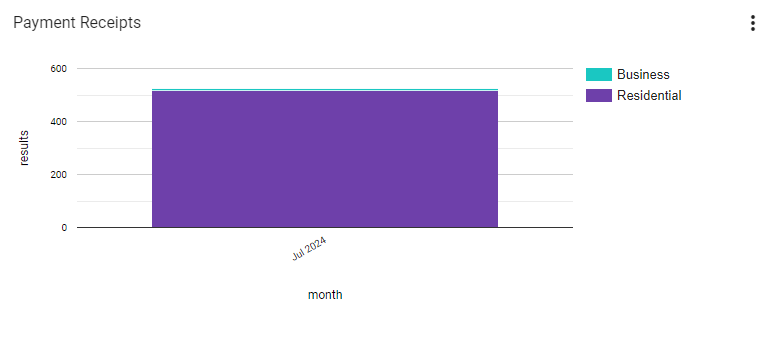
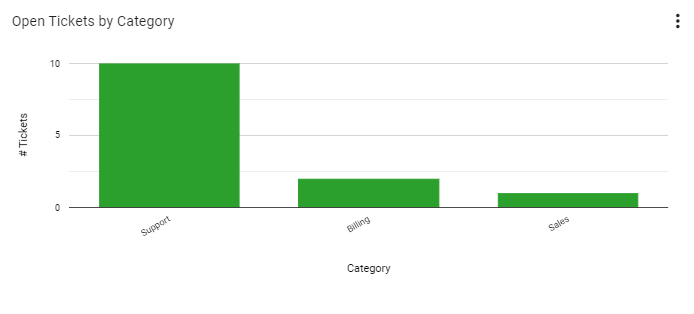
Common Report Card Examples
The following images are examples of commonly used report dashboard cards that we recommend our users to have on their dashboard to get a quick glimpse at what is happening with their subscribers.