System Cards
The Subscriber's Summary page may be customized with various System Cards that contain information related to this Subscriber.
Each Vision user is able to choose the System Cards that are displayed to them. This allows for quick and reliable access to the most relevant information. For example, the Vision user may choose the tickets card to be displayed to quickly see tickets associated with a subscriber or view open tickets.
Cards are displayed under each Subscriber Account Summary page and display information about that customer.
View More Details on Types of Summary Cards Below:
Learn more about the Subscriber Summary Display and how to make edits to the display settings.
Current Summary Cards Available: (Card options may vary based on integrations.)
Services, Invoices, Payments, Tickets, Notes, Contacts, Locations, Workflow Processes, Subscriber Overview, Payment Methods, Active Services, Plume Services, Preseem Bandwidth Summary, Preseem Bandwidth Summary 48 Hours, Preseem Bandwidth Summary 7 Days, NOMS Services
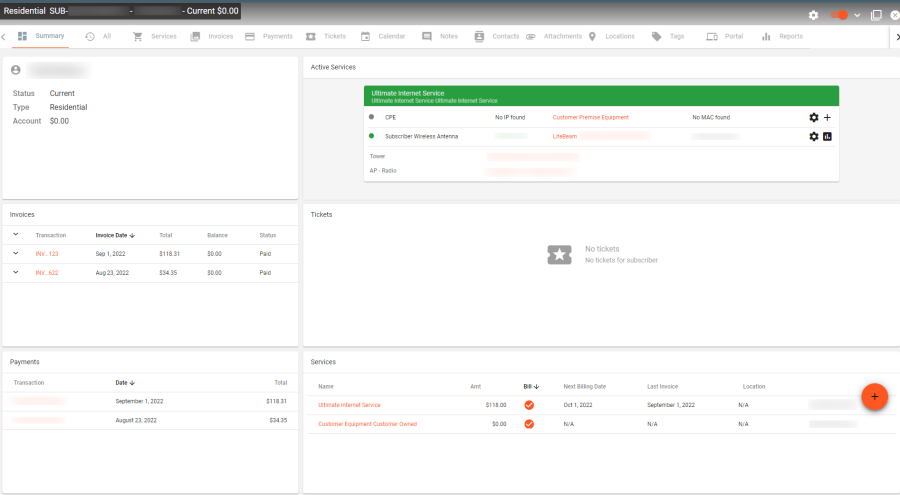
Active Services
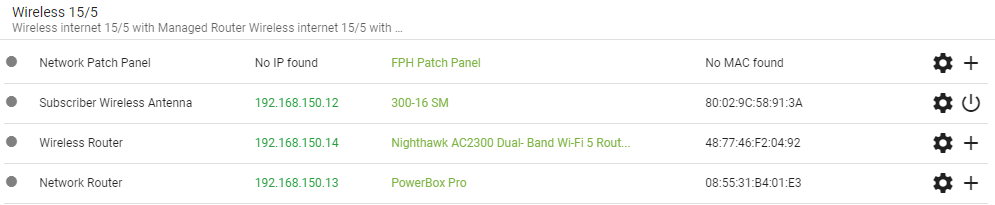
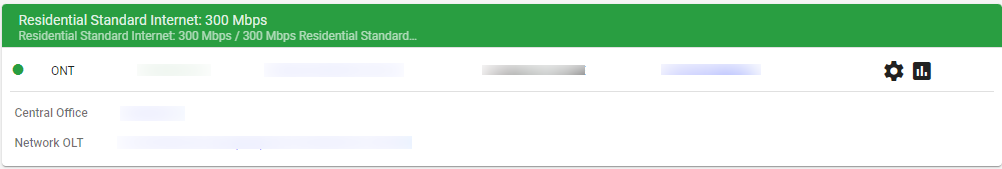
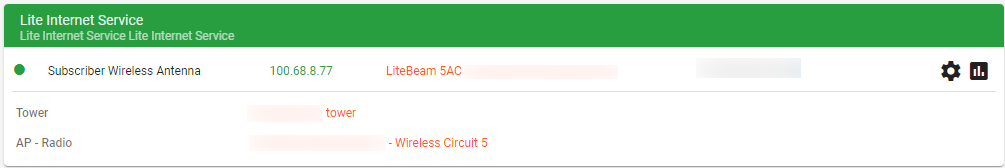
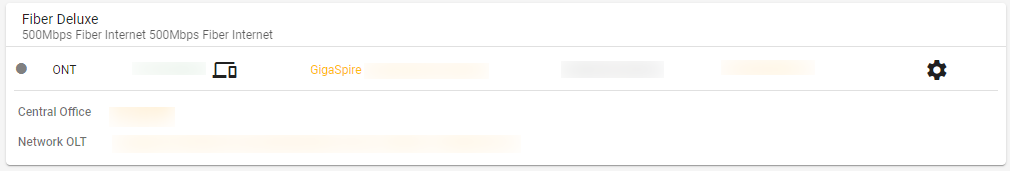
The Active Services Card is a handy card to have displayed because it shows the current services that are active on a Subscriber Account.
View the associated MAC address, serial number, IP address, Central Office, OLT and ONT.
Click on the highlighted text on an active services card to be redirected to the specific piece of Hardware. Hover over the highlighted text to view a description of the available actions.
If a service package has multiple pieces of hardware associated with it, one single active services card will display all of the packages' hardware.
Cards option will vary based on integrations.


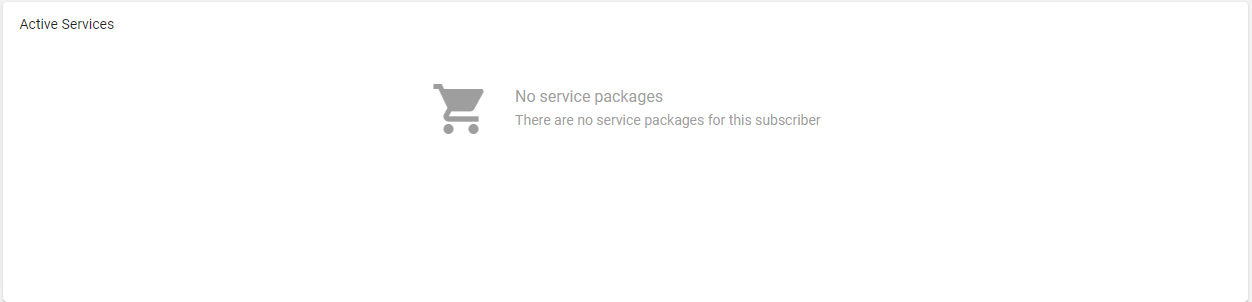
If there are no active service packages, the system card will be blank. See example below.
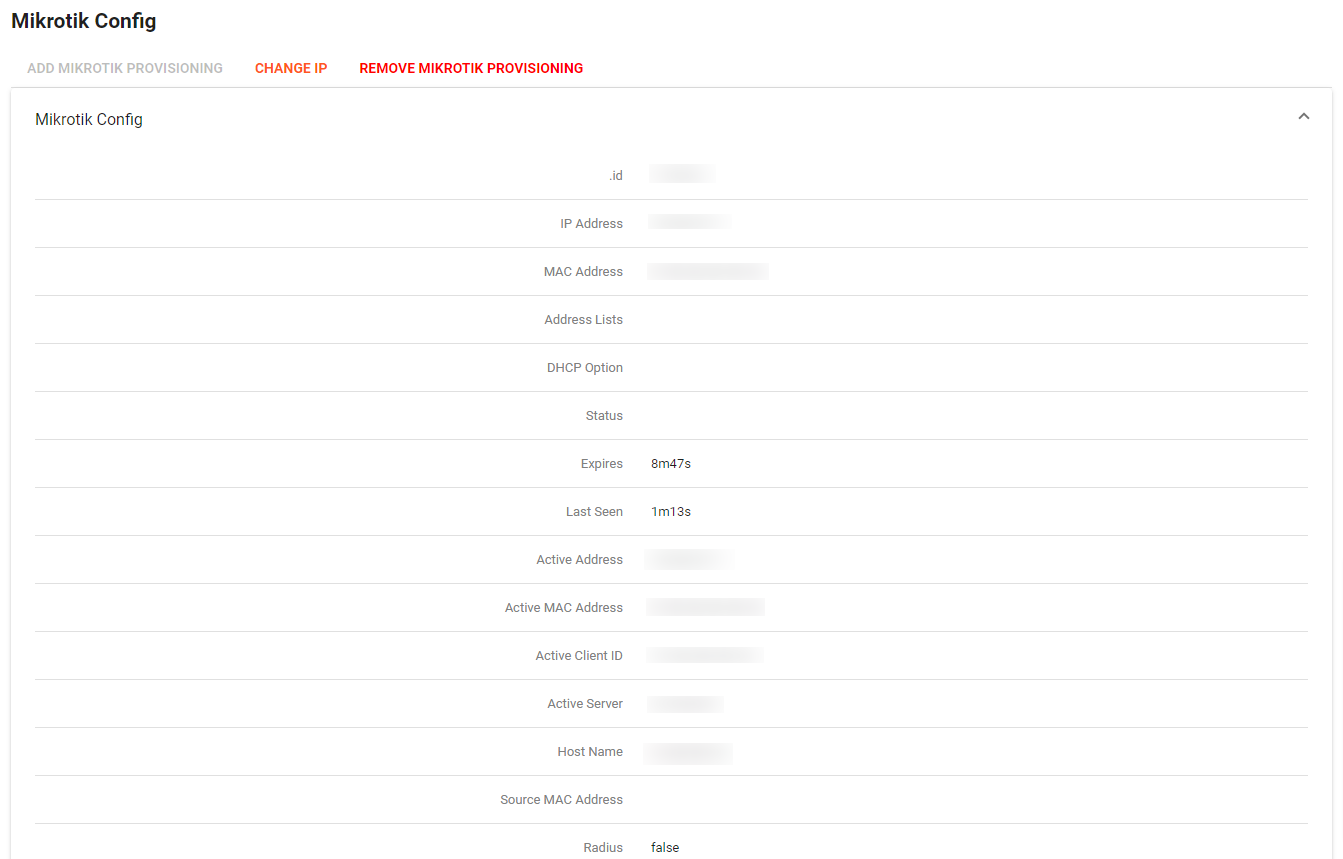
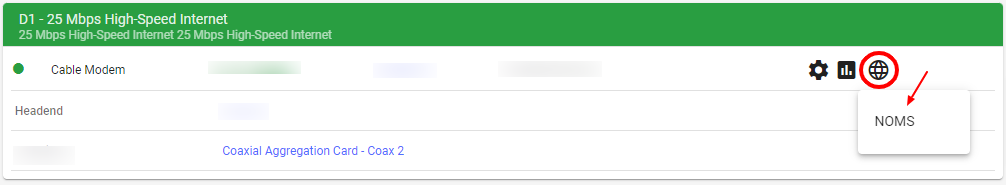
Vendor Configurations
The 
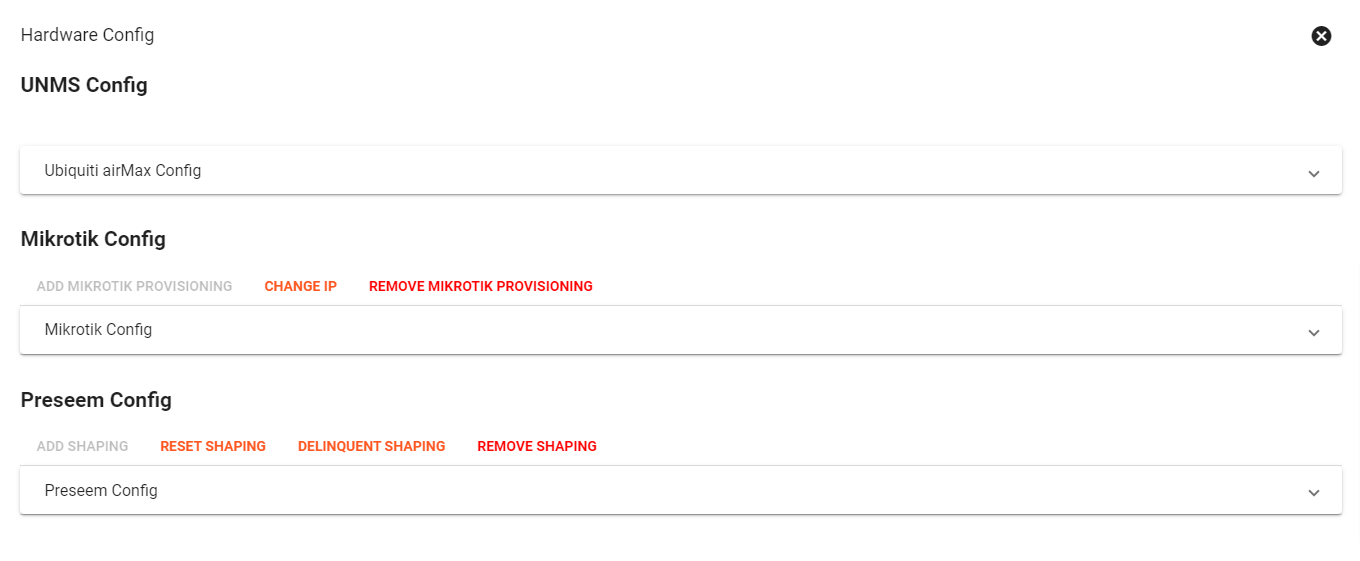
Click on the dropdown menu to view more details about the device, like the IP address and MAC address (redacted in the below image for security purposes).
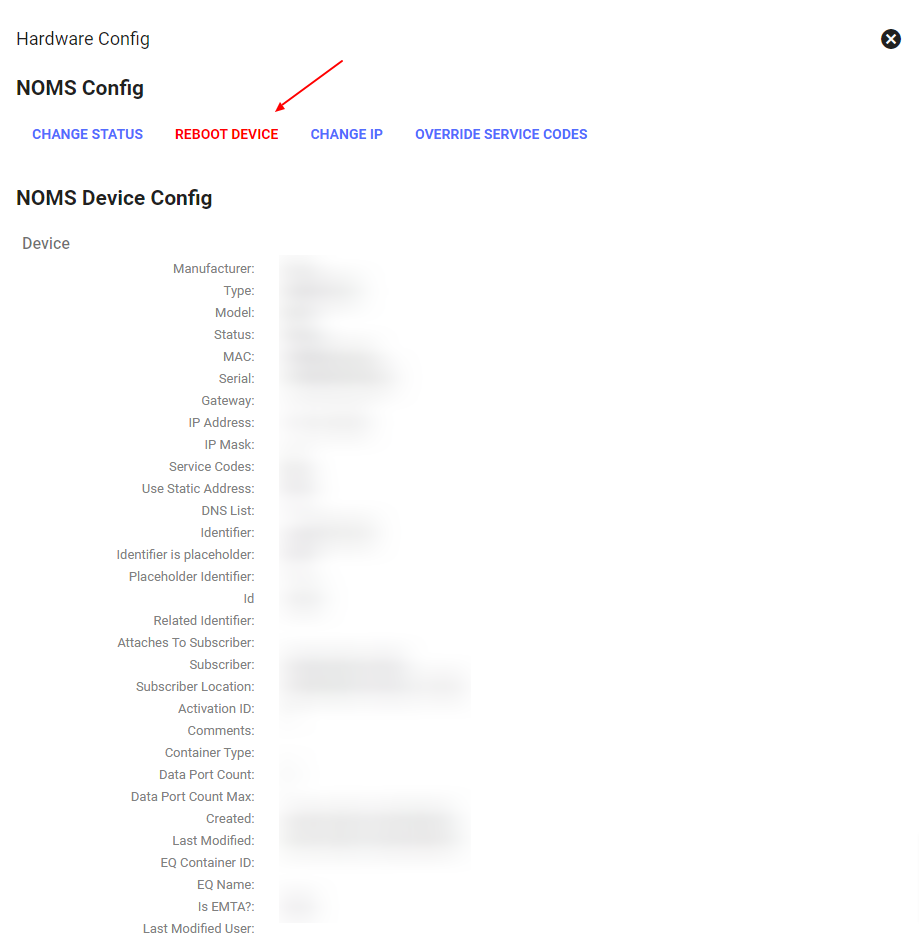
Viewing the NOMS Config will be where to find the REBOOT DEVICE button.
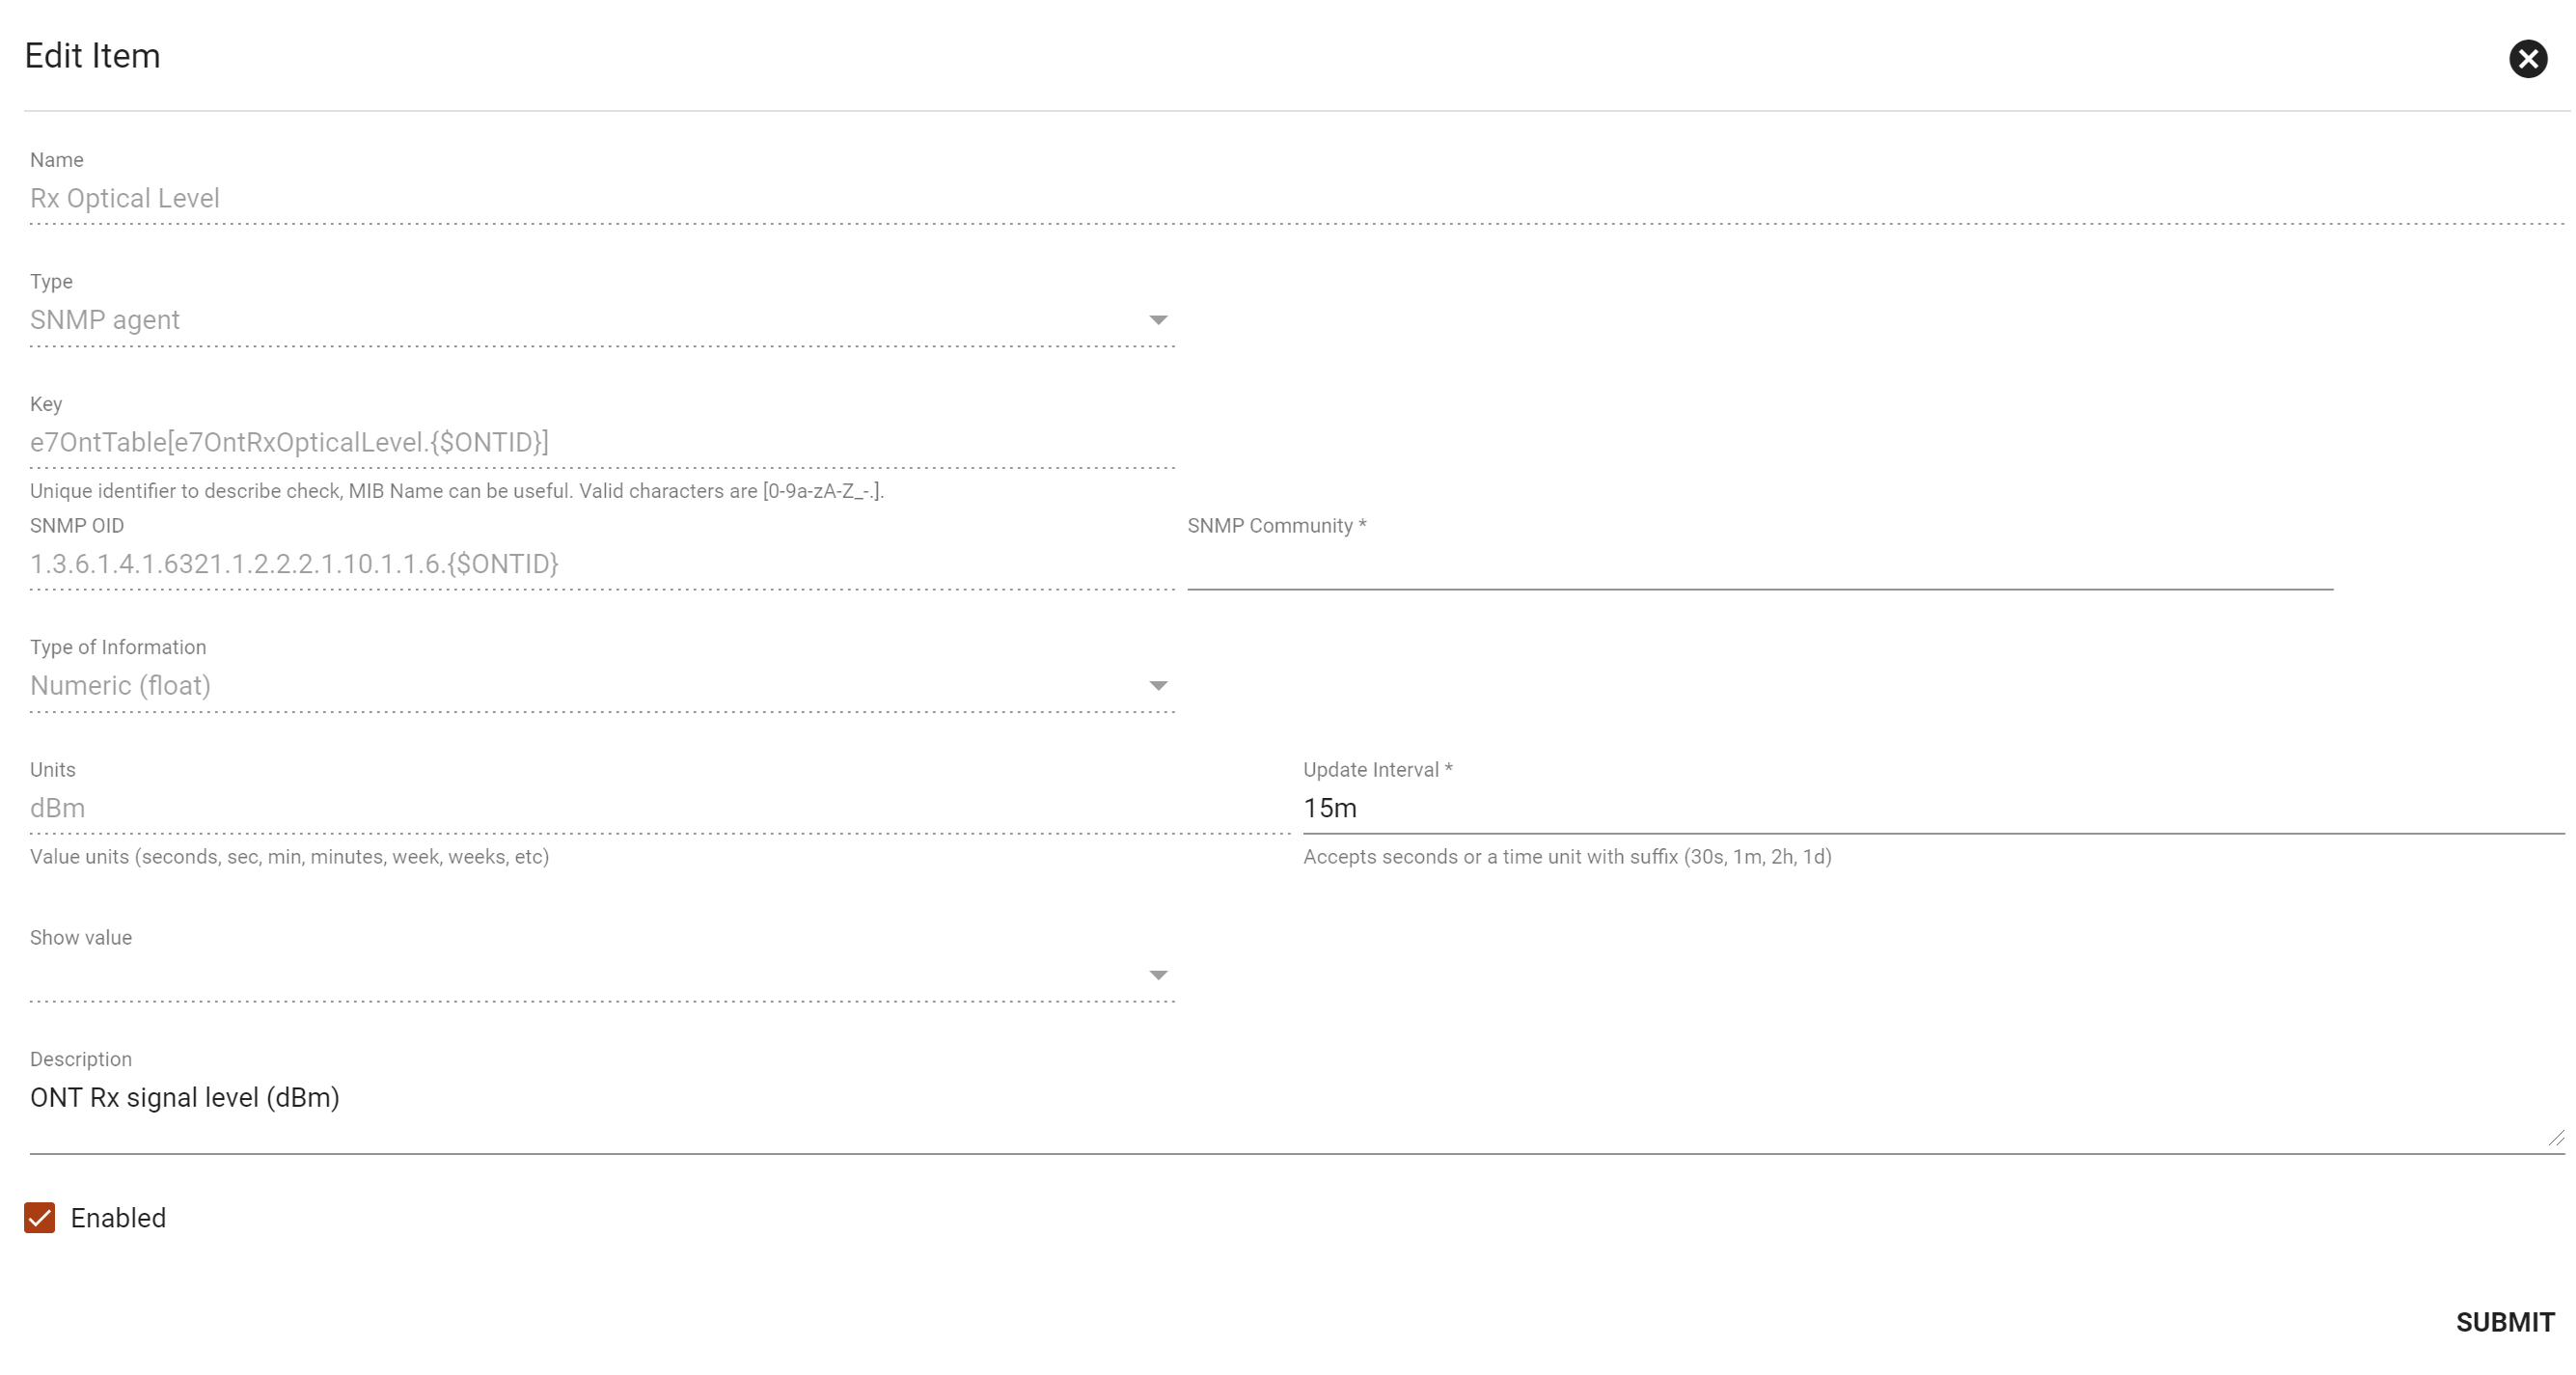
View Monitored Items
Select the 
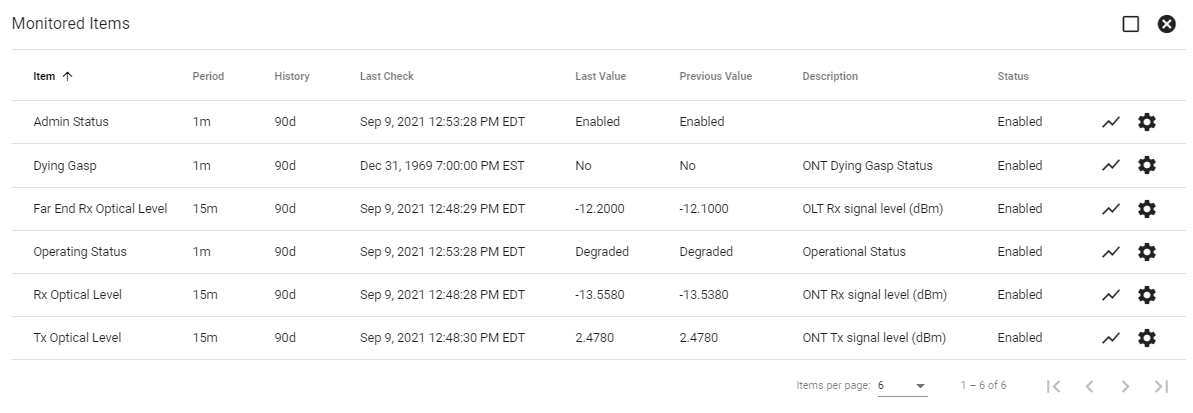
Click on the 
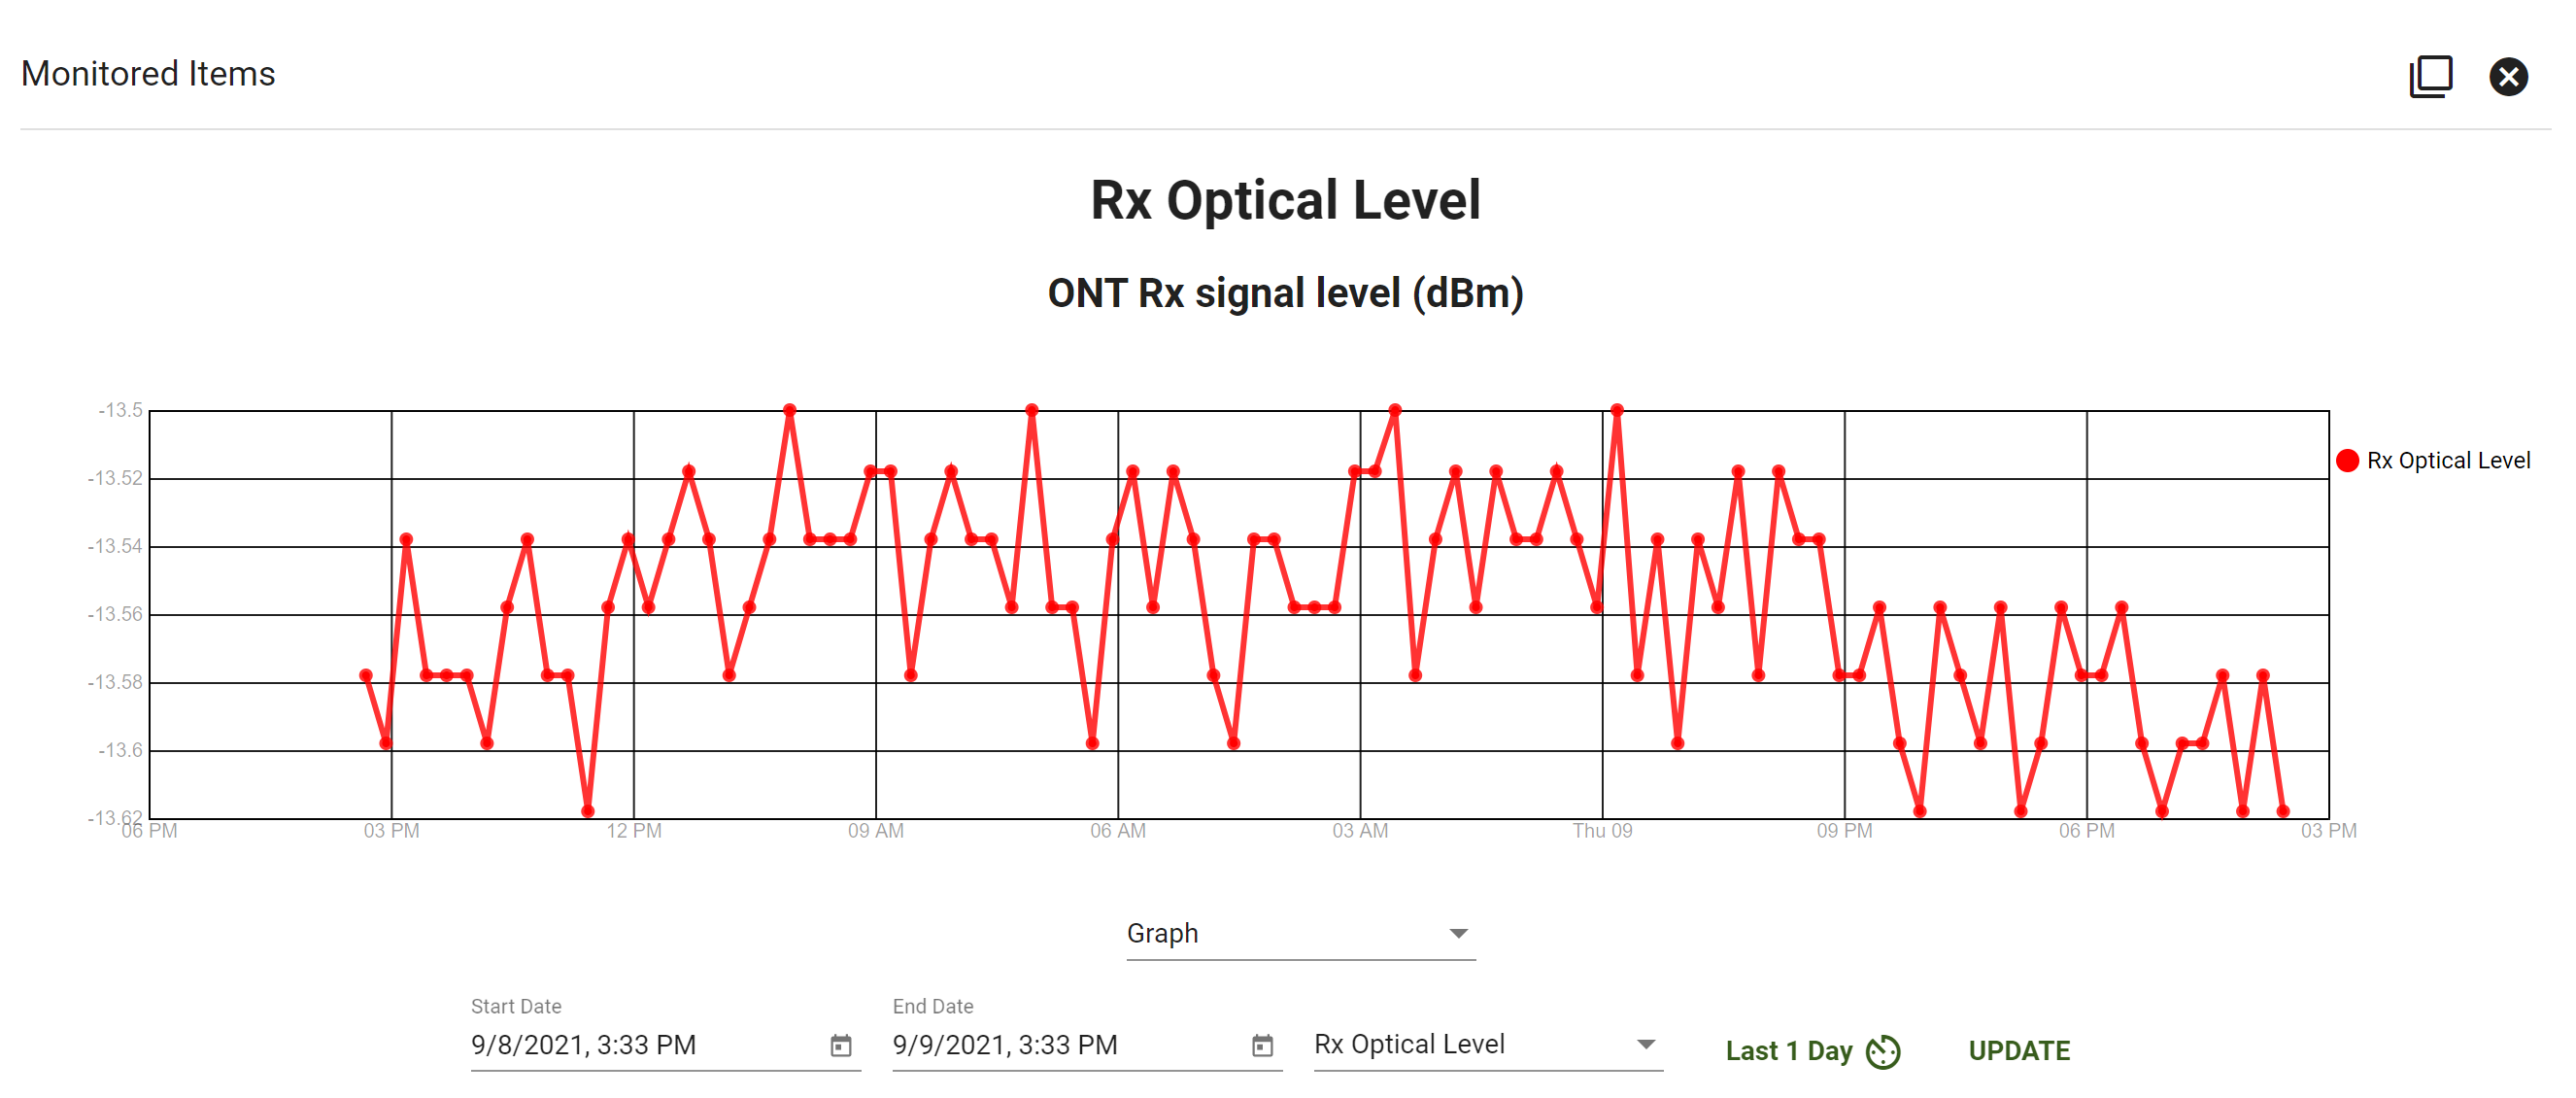
Select the
Vendor Links
Click on the 
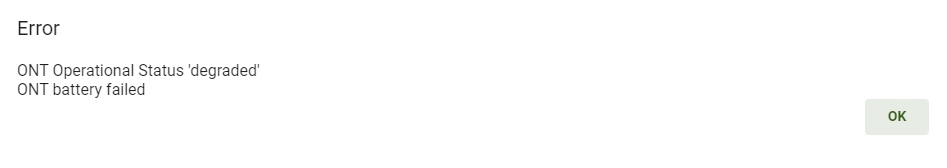
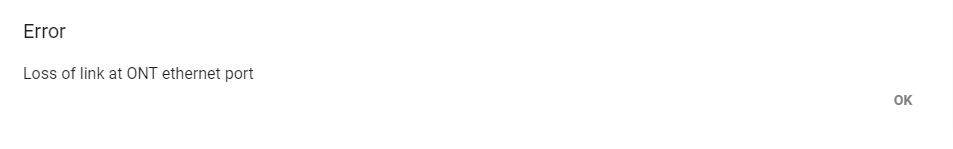
View Hardware Problems
Click the 
View Hardware Status
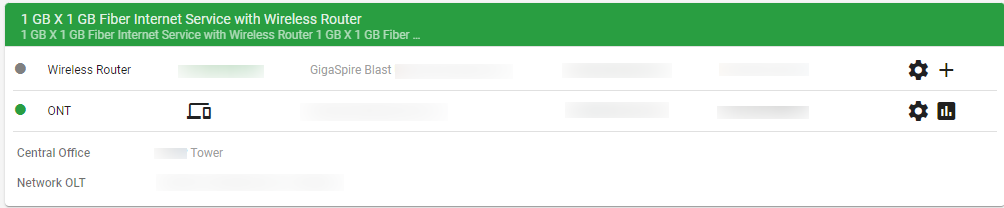
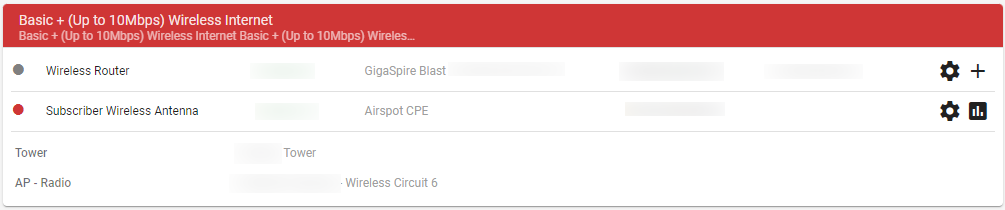
Easily view the Hardware status by looking at the colored dot to the left of the piece of hardware, or by looking at the header bar of the card. This color denotation is a quick and easy way to troubleshoot a Subscriber account and determine if there is a service outage or an equipment failure.
The green bar and green dot indicate that the Hardware is being monitored and is working correctly.

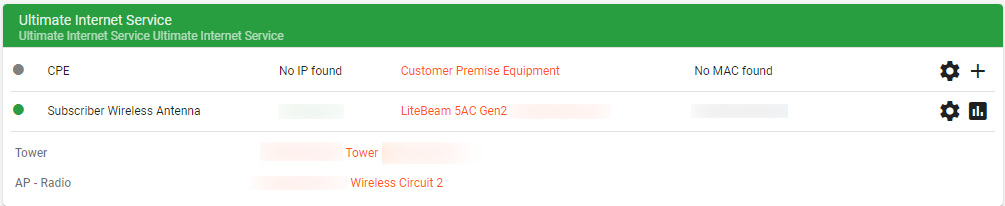
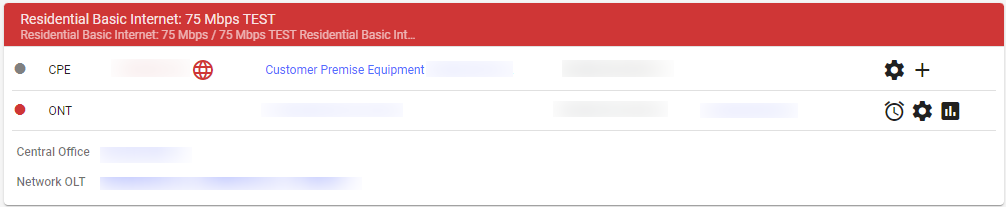
The red bar and red dot indicate that the Hardware is not responding.

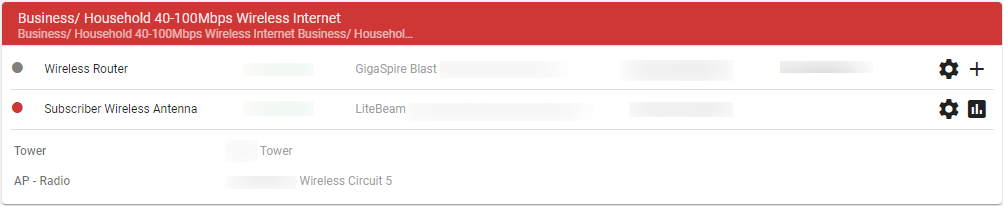
The yellow bar and yellow dot indicate that the Hardware is still responding but is losing signal strength.

A white bar and gray dot indicate that the Hardware is not being monitored.

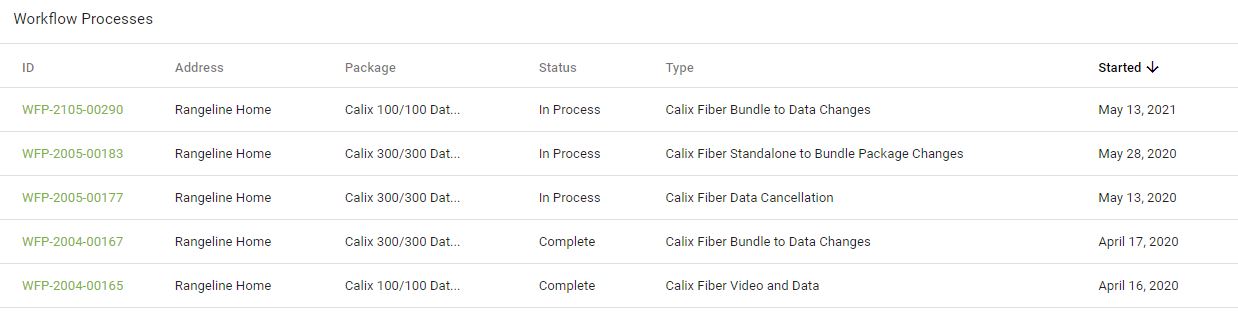
Workflow Processes
View the Workflows associated with a specific Subscriber, including the address, Service Package, Workflow status, type and start date.
Click on a line item to view the tasks associated with that specific Workflow.
Vision supports a variety of integrations and has the capacity to add additional ones as needed. These third-party vendors are able to communicate directly with Vision to streamline your user experience. We are continuing to expand our integration capabilities. Below are examples of a couple of integrations.
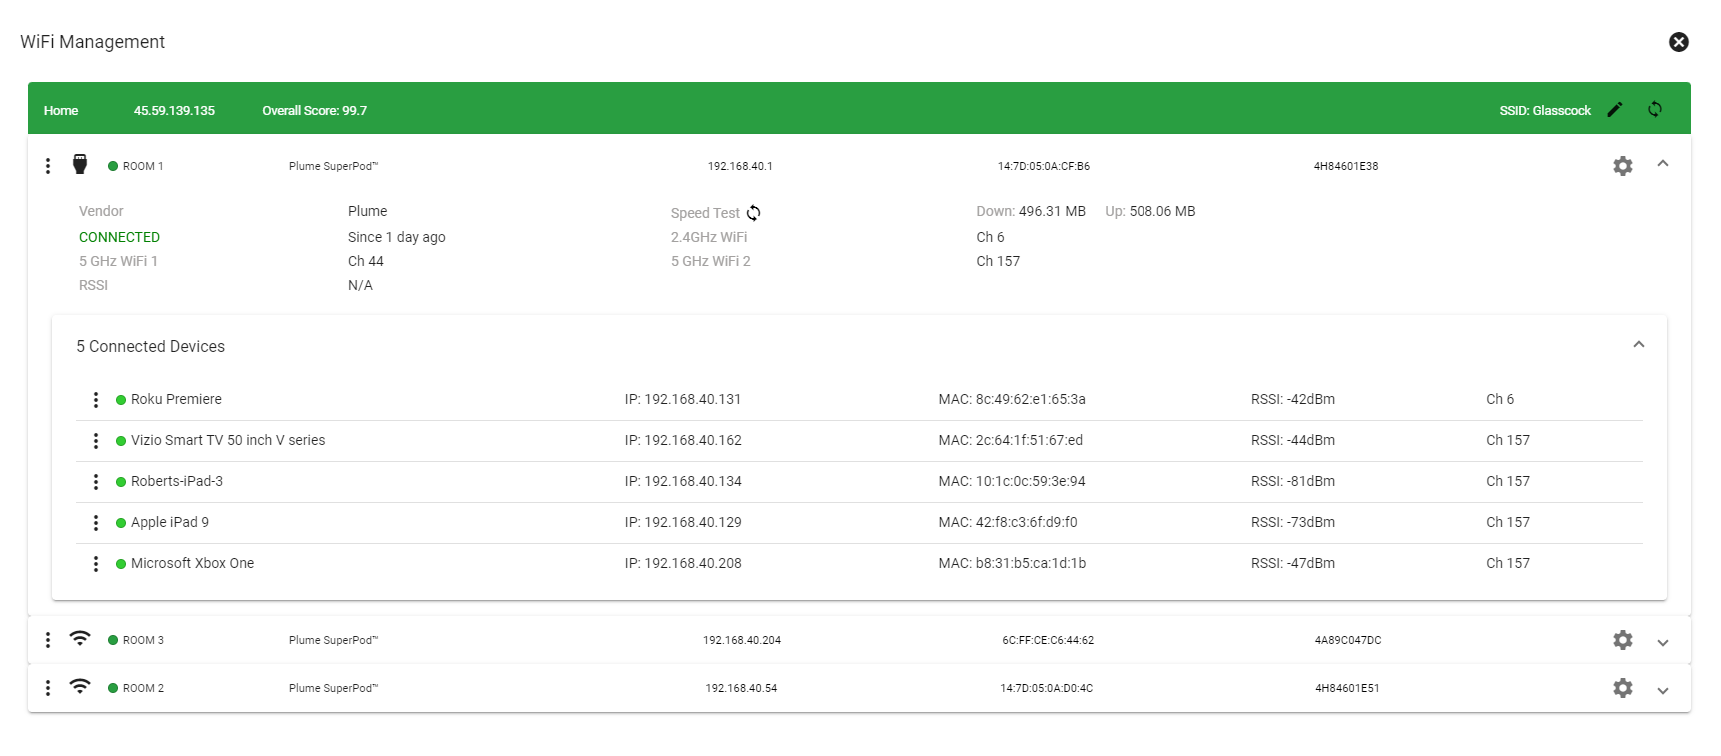
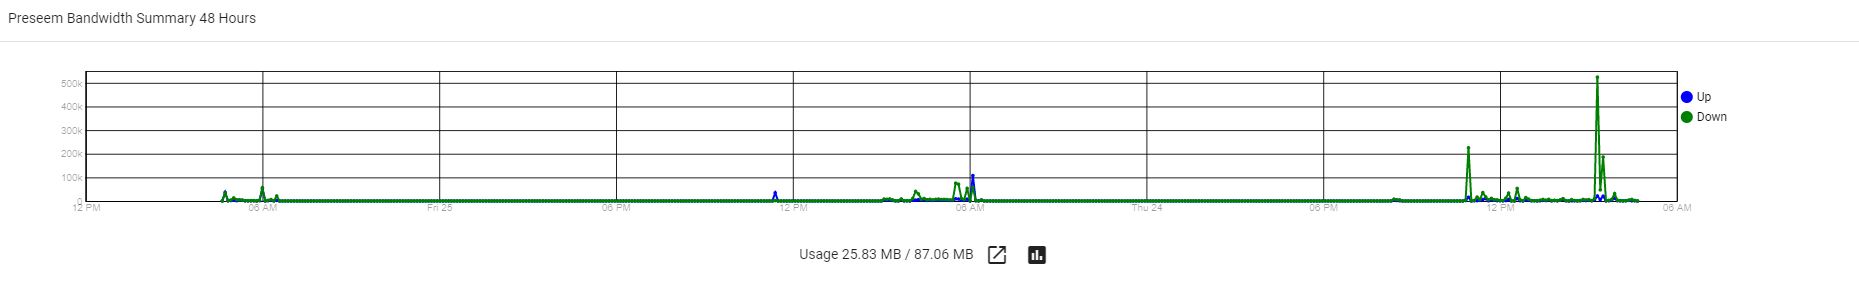
Preseem
The Preseem summary cards show the shaping traffic bandwidth history that is pertinent to a specific Subscriber.
Click on the
Select the 
View the summary over different lengths in time in relation to the bandwidth.
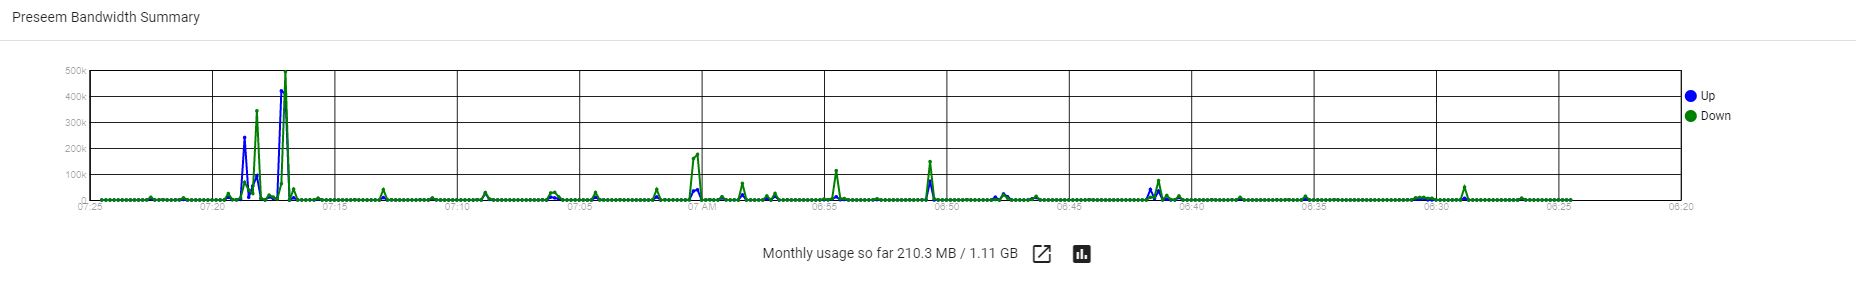
Click and drag on a portion of the chart to zoom in on the data.
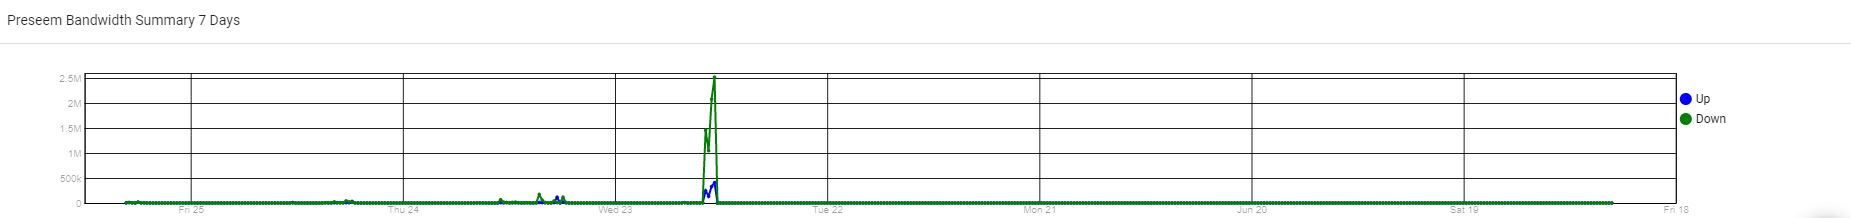
View the analytics in seven day and 48 hour increments.
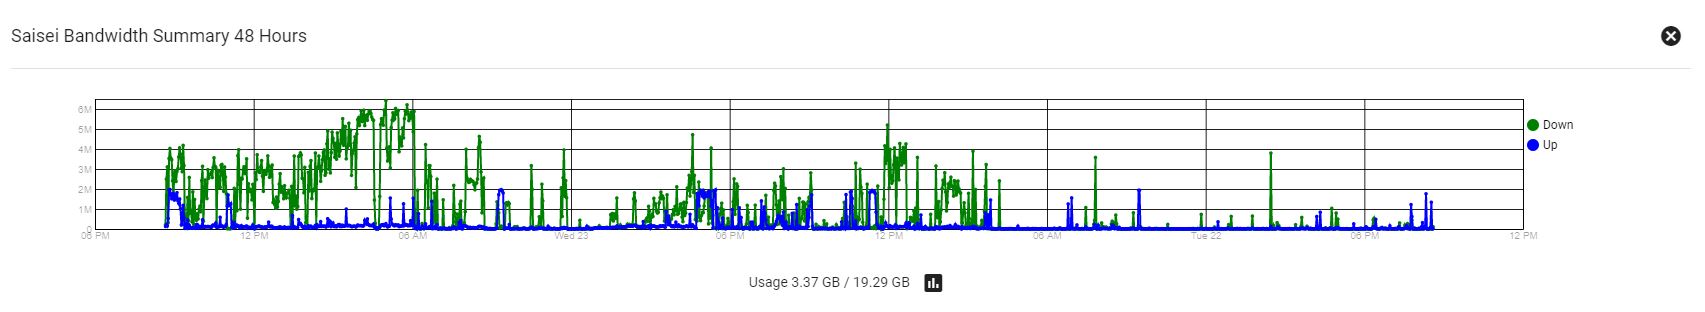
Saisei
The Saisei summary cards show the shaping traffic bandwidth history that is pertinent to a specific Subscriber.
Click on the
View the summary over different lengths in time in relation to the bandwidth.
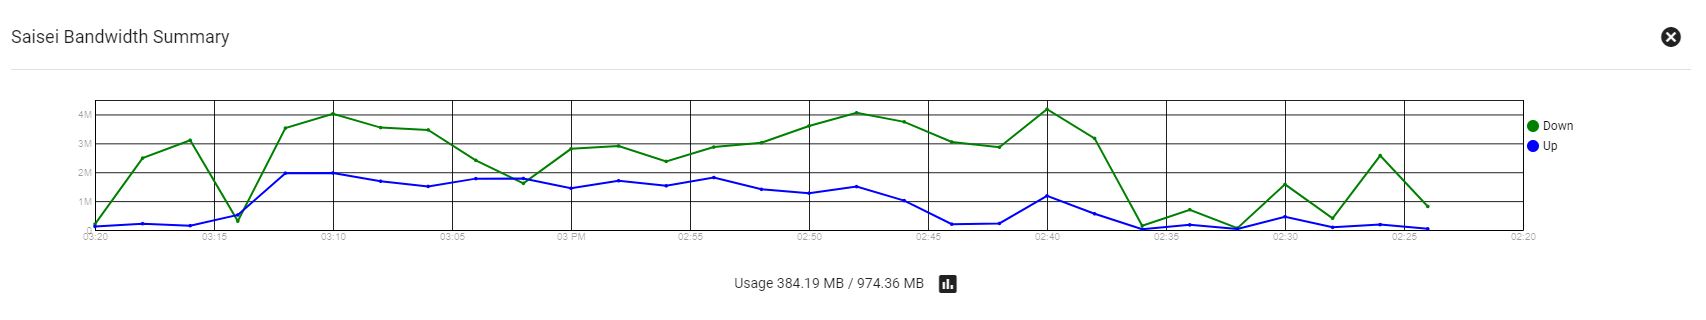
Click and drag on a portion of the chart to zoom in on the data.
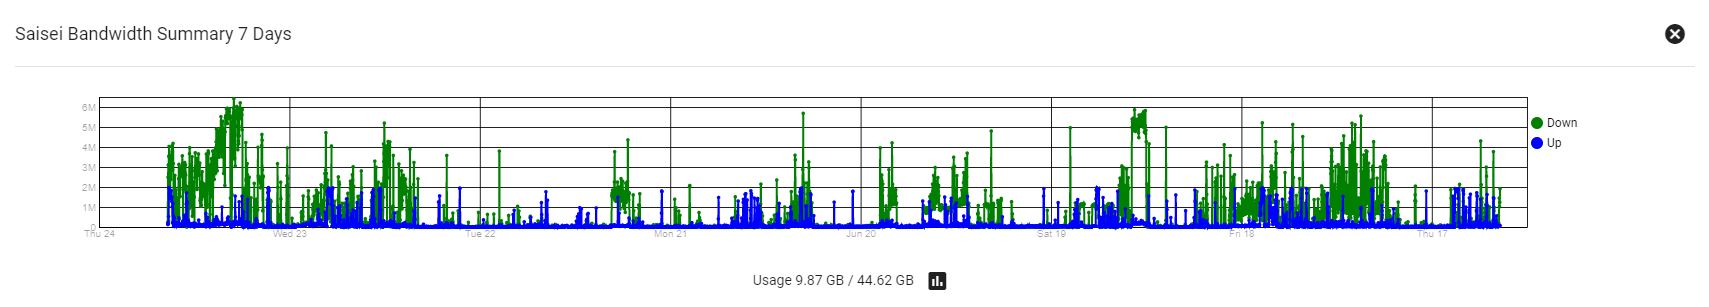
View the analytics in seven day and 48 hour increments.